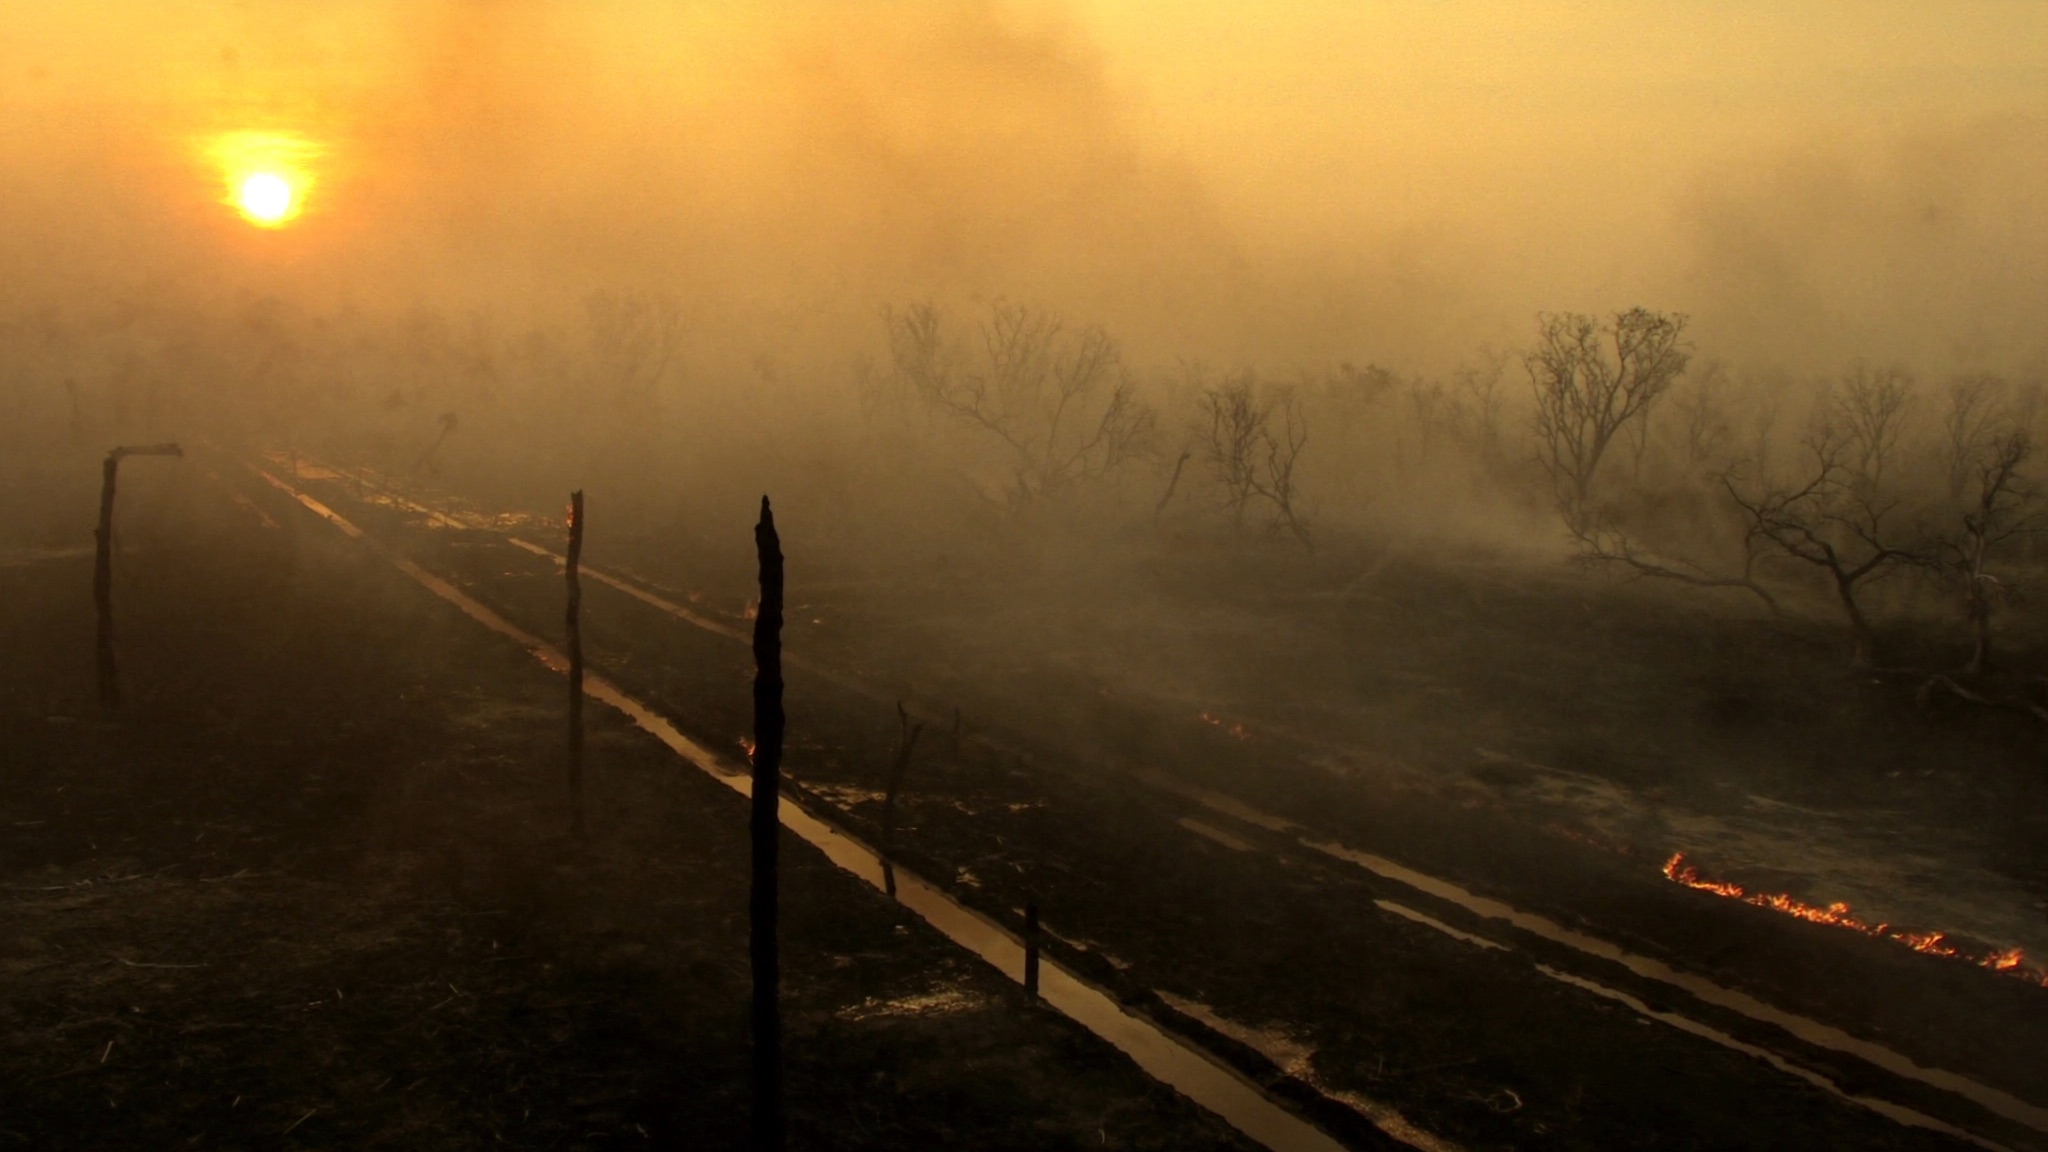
Illustration generated with AI · not photojournalism
Kalimantan's water table problem
The fires are annual, and the pattern is real — but it isn't a fire pattern. It's a hydrology pattern gated by ENSO and triggered by people. That distinction decides which parts of the problem AI can actually move, and which parts it only decorates.
Does it happen every year?
Every year, June–November, peaking September–October. But scale swings 8× between years — and ENSO plus the Indian Ocean Dipole explain most of that swing.
Is there a pattern?
Rainfall below ~6 mm/day flips fire activity exponentially. May-initialised seasonal forecasts explain R² = 0.70–0.76 of Kalimantan burned area — five to seven months ahead.
Can AI prevent it?
AI can move three things: water-table prediction, seasonal budget allocation, and evidence-grade burn attribution. It cannot move ignition economics, suppression capacity, or fine collection.
So what actually solves it?
Intact peat cannot burn at any El Niño strength. Only rewetting attacks that; suppression, village payments and uncollected fines do not. The realistic goal is collapsing the ceiling, not ending the season. See §05.
The pattern is a sawtooth, not a trend
01 · WHAT REPEATSIndonesia's burned area does not creep upward. It spikes in El Niño years and collapses in La Niña years, with a floor of roughly 200,000–400,000 ha in a quiet year and a ceiling above 2.6 million ha in a bad one.
Over southern-central Kalimantan the dry season runs June to November, and more than 95% of fires fall inside it. The trigger is a sharp rainfall threshold: below about 6 mm/day, fire activity rises exponentially; above it, fire is close to negligible. This is why the season has a hard edge rather than a gentle ramp — in 2026, high-confidence hotspots sat under 74 per month from April to June, then jumped to 615 in July.
National burned area, 2015–2026
Ministry of Forestry / SiPongi · hectaresWhere the year's fire sits
Indicative climatology · southern KalimantanENSO × IOD, Kalimantan peak-season burned area
Hectares · regime compositesWhere 2026 sits
This season is the most dangerous configuration in a decade. NOAA's Climate Prediction Center put a >90% chance of a very strong El Niño through late 2026 into winter 2026–27, with a 69% chance of a historic event exceeding +2.5 °C RONI. BMKG already applies the "sangat kuat" label to current conditions, citing Niño-3.4 at +2.19 in July rising to +2.77 in early August, plus a positive IOD through year-end.
Official burned area stands at 202,004 ha for January–July — the highest of the last three El Niño years at the same point (2023: 92,924 ha; 2019: 137,007 ha), though still well below 2015. West Kalimantan is the worst-hit province nationally, at 38,311 ha through 20 August by the provincial disaster agency's count, concentrated in Ketapang, Kubu Raya and Mempawah.
On the September–October climatology, the worst six to eight weeks of this season were still ahead at the time of writing.
The mechanism is drainage, and it is engineered
02 · WHY IT BURNSIntact tropical peat swamp does not burn. It is waterlogged — flooded up to two metres deep in the rainy season. What burns is peat that has been drained, and drainage in Kalimantan is a deliberate, mapped, hundred-thousand-kilometre piece of infrastructure.
The Mega Rice Project cut more than 4,000 km of canals through Central Kalimantan peat between 1996 and 1998, targeting a million hectares. It was abandoned; the canals were not. Across Sumatra, Kalimantan and Papua, civil-society mapping now counts 281,253 km of drainage canals through peatland — mostly inside 4 million ha of oil palm and 2.5 million ha of pulpwood concessions.
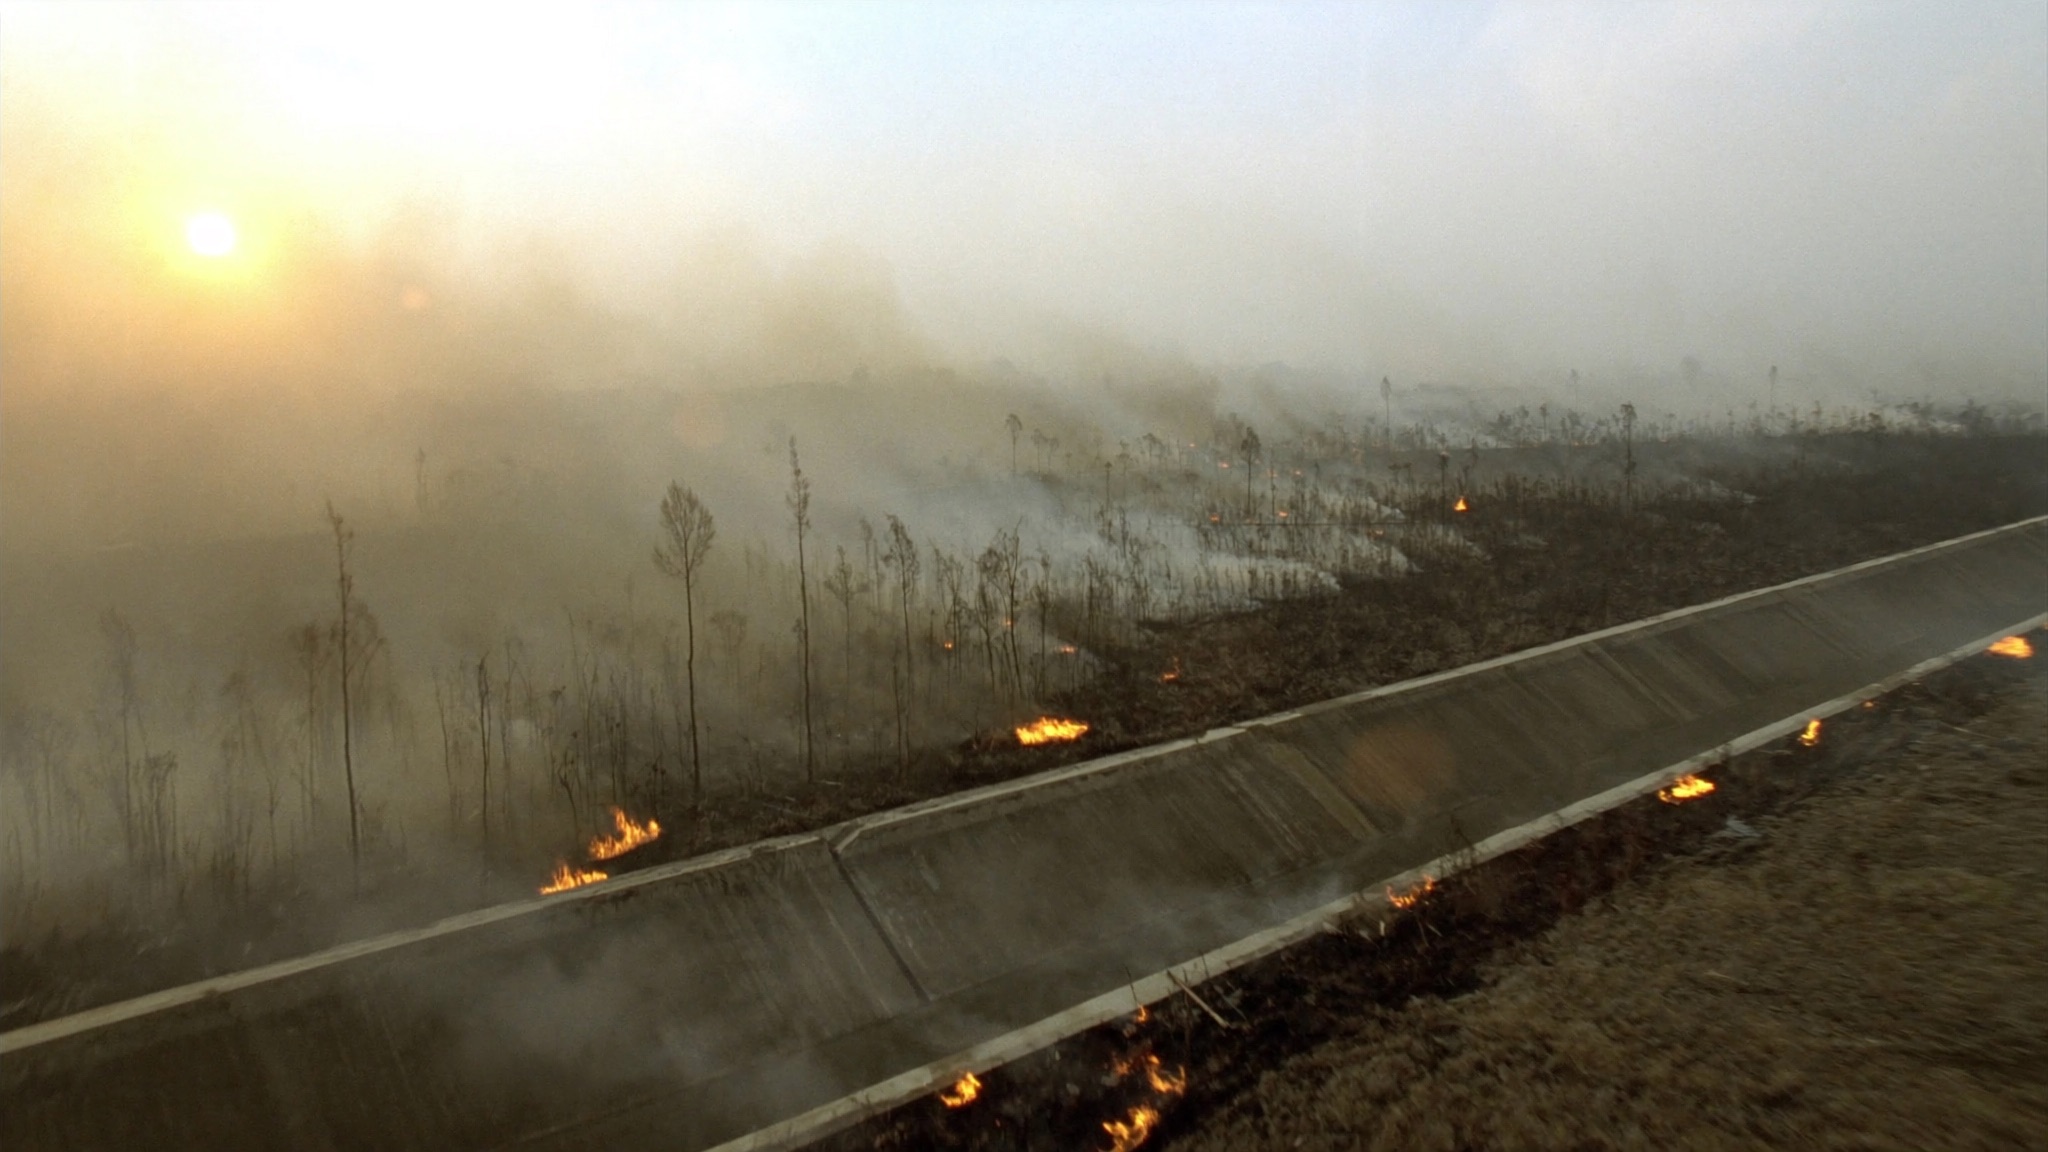
The effect is quantified. Days in the high fire-hazard class go from 3.8% to 17.1% — a 4.5× increase in fire susceptibility, purely from the canals.
Why the fire is so hard to kill once it starts
Peat burns by smouldering — flameless, low-temperature, subsurface combustion spreading at roughly 1 mm per minute, about 100× slower than a flaming front, but consuming ~75 kg of fuel per m² against ~0.5 kg/m² for a surface grass fire. It burns downward, persists for weeks to months, survives rain, and reignites the surface after water-bombing has "put the fire out."
Suppression requires roughly 5.7 litres of water per kilogram of peat, essentially independent of flow rate or wetting agent — you have to flood the layer. In roadless peat swamp with no water source, that number is the whole story. A perfectly predicted fire in a place with no crew and no water burns exactly as long as an unpredicted one.
And the regulation targets the wrong number
PP 57/2016 declares a cultivated peat ecosystem "damaged" if groundwater falls more than 40 cm below the surface. The threshold has been criticised as set without prior research; empirical critical depths in tropical wetlands range from 40 cm to 100 cm depending on peat type and site, with one South Sumatra study putting it at 85 cm. There is no universal number — which is precisely the kind of gap a model can fill.
“The net present value of cleared land was, and is, very high relative to burning costs.”
— Authors of a randomised trial in West Kalimantan: 75 villages paid up to Rp 150 million to stay fire-free vs 200 controls. Result: 28% of paid villages stayed fire-free, against 29% of controls. No effect.
That RCT is the single most important result for anyone designing an intervention here. Ignition is an economic decision, and cash at that scale does not change it. It is also a collective-action problem: in villages of ~320 households where only ~1% practise slash-and-burn, one defector is enough to lose the payment for everyone.
Attribution is contested too. WALHI's 2026 analysis found 74% of Kalimantan hotspots inside licensed concessions — but CIFOR's finding is that only about one in five fires actually starts inside an oil palm concession, because communities live and farm inside concession polygons and fires lit outside spread in. Polygon overlay overstates corporate causation. Unclear land tenure is the deeper driver: fire is cheap, and it stakes a claim.
Where AI genuinely earns its keep
03 · THE THREE REAL PROBLEMSThree of these have published evidence behind them. The rest of the field's output is susceptibility maps with impressive AUCs that rediscover what land managers already know.
1 — Predict the water table, not the fire
This is the highest-confidence recommendation in the whole domain, and it is not obvious. In Riau, an ANN on weather alone reached R² ≈ 0.4 on fire counts; adding simulated water-table depth and soil moisture took it to R² ≈ 0.8, and halved timing error. In South Kalimantan, a random forest using only hydrological inputs — groundwater level, soil moisture, soil temperature — beat every model that included meteorology.
Why it's the right target: water table is causally upstream of ignition; it is a continuous regression problem rather than rare-event classification; it is directly actionable (canal blocking, pumping); and it is what the regulation nominally governs. Fire probability falls out almost mechanically.
2 — Seasonal outlooks, to move money before the season
ECMWF seasonal rainfall forecasts initialised on 1 May explain R² = 0.70–0.76 of Kalimantan burned area for the following June–November — against R² = 0.86–0.90 for observed rainfall, so the forecast captures most of the achievable signal. That is five to seven months of lead time: enough to reallocate budget, pre-position crews and raise water tables before anything is lit.
Hard limit: ProbFire, the best published Indonesian ML early-warning system, beats climatology at 2–4 months lead in South Kalimantan, South Sumatra and South Papua — and shows no skill at all in West Kalimantan, which is IOD-driven rather than cleanly ENSO-driven. West Kalimantan is exactly where 2026 is burning worst. Ask any vendor for per-province skill.
3 — Evidence-grade burned-area mapping
ML burn-scar detection on Sentinel-2 genuinely outperforms manual delineation at national scale. Nusantara Atlas / FireWatch reports 98.7% user accuracy on a peer-reviewed method. This is retrospective, not predictive — but it is the evidentiary substrate for enforcement, carbon-credit MRV and EUDR attestation.
Read the metric precisely: user accuracy is the commission side — of what it maps as burned, 98.7% really burned. It says nothing about omission. The system prioritises high-confidence detections and produces deliberately conservative estimates. That makes it right for accusing a company and wrong for estimating national totals. Both uses happen anyway.
Overrated — "AI fire risk maps" with AUC 0.95+
These proliferate in the Indonesian literature. They are presence/pseudo-absence susceptibility models, and what they mostly learn is that fires happen on drained peat near canals near roads in the dry season in places that burned before. A 2025 critical review of AI for wildfire management found operational uptake "remains limited" despite escalating publication counts, and flags misleading accuracy on imbalanced data, reliance on simulated rather than field data, and models that "optimize for metrics disconnected from practical firefighting needs."
If 2% of grid-cell-days have fire, a model that always predicts "no fire" scores 98%. Treat any headline accuracy without a base rate as uninformative.
Overrated — faster real-time alerting
Detection latency is not the binding constraint; the physics of smouldering is. VIIRS gives 375 m pixels, two looks per satellite per day, arriving up to three hours after overpass — and hotspots over Indonesian peat correspond to real burns only ~62% of the time, reaching 83% only for burns above 14 ha. Roughly 13% of all Indonesian VIIRS detections aren't biomass burning at all (volcanoes, gas flares, smelters, coastal artefacts) — removable with a static exclusion map, no ML required.
Tellingly, the measured benefit of SiPongi's patrol app was 36–56% faster paperwork, not fires caught earlier. ASEAN Fire Alert already pushes hotspot notifications to landholders — once a day, at 19:00. Nobody has demonstrated that faster alerts reduce hectares burned in Indonesian peat.
Hardware, not algorithms — sub-pixel and smouldering detection
Smouldering peat radiates only slightly above already-burnt ground, making the two near-inseparable in thermal bands. Even peat-tuned algorithms on Landsat-8 show 45% omission error. Gains here come from better sensors — FireSat's 5 m detection floor (three satellites launched July 2026, initial capability Q4 2026), thermal drones — and from multi-sensor fusion, not cleverer models on VIIRS. And FireSat's 5 m spec is a flaming-fire threshold; nothing public addresses cool subsurface smouldering.
You cannot ML your way out of a 375 m pixel observed twice a day through smoke.
The blockers no model removes
04 · READ BEFORE BUILDINGIndonesian peat fire is a land-tenure and enforcement problem wearing a remote-sensing problem as a costume. Four constraints sit entirely outside the model.
The concession map is legally public and practically secret
You cannot attribute a burn to a company without knowing where its land is. Indonesia's Supreme Court ruled in 2017 that HGU plantation-concession documents are public information; a 2020 administrative court reaffirmed it; a 2021 ruling exhausted all appeals. The land ministry has still not complied, citing national security and intellectual property — stonewalling other government agencies and lawmakers, not just NGOs. The Agrarian Minister has separately stated that 537 palm oil companies operate with no HGU at all. Every concession-overlay attribution in circulation runs on reconstructed, incomplete boundary layers.
Judgements are won and not collected
| Company | Fine ordered | What actually happened |
|---|---|---|
| PT Merbau Pelalawan Lestari | Rp 16.2 tn | Company assets valued at Rp 156 bn — about 1% of the fine |
| PT Jatim Jaya Perkasa | Rp 491 bn | Violated the court order by replanting banned peatland |
| PT Waringin Agro Jaya | Rp 466 bn | ~Rp 40 bn recovered via asset auction |
| PT Kallista Alam | Rp 366 bn | Payment began after a decade of delay |
| PT Ricky Kurniawan Kertapersada | Rp 191.8 bn | Filed bankruptcy without listing the state as a creditor |
| PT Bumi Mekar Hijau | Rp 78.5 bn | Paid in full |
| Total ordered | Rp 21 tn | “Almost none” collected |
Read the Merbau line again. A Rp 16.2 trillion judgement against a company holding Rp 156 billion of assets is the clearest possible statement that the constraint is not detection, not attribution, not even adjudication. It is collection. Better data does not fix an uncollected-judgement problem.
Note also what the landmark cases actually ran on: ground-based peat sampling by forensic scientists, not satellite imagery. The PT Kalimantan Lestari Mandiri ruling (Rp 210.5 bn plus Rp 89.3 bn restoration) rested on peat samples collected by an IPB forestry scientist — who was then sued by the company, and cleared in October 2025. A defensible chain from satellite pixel to legal liability has not been established in Indonesian courts.
The ground-truth layer went backwards
This is the most consequential and least-reported fact in the file. BRGM, the peat restoration agency, was dissolved in December 2024 when its mandate expired. As of early 2026 its successor "lacks a clear implementation plan regarding restoration infrastructure," and SIPALAGA — the telemetered peat water-table sensor network — and the PRIMS restoration dashboard had not resumed full operation.
So Indonesia entered its most dangerous fire configuration since 2015 having dissolved its peat agency, with the sensor network that any water-table model needs sitting degraded. Any serious proposal has to start there: this is a hardware and institutional problem before it is a modelling one.
And the money moved the wrong way
BNPB's own 2026 institutional budget is Rp 491 billion (~US$27.5m), down 75.6% year-on-year and the lowest in about 15 years. (The larger Rp 5 trillion on-call disaster fund sits with the Finance Ministry, not BNPB, and is released on request — so the headline is real but not the whole picture.) Against that, restoring 2.49 Mha of peat is costed at US$3.2–7 bn, roughly $1,280–2,810/ha — against $28 bn of damage from the 2015 fires alone.
The cost-benefit case for rewetting is overwhelming and has been for a decade. It still does not get funded from the public purse.
What would actually work
05 · THE INTERVENTION“So that it does not recur” is the wrong target, and chasing it is why so much money goes to so little effect. Fires in the June–November window will always happen; the floor in a quiet year is 200,000–400,000 ha. What is achievable is collapsing the ceiling — breaking the link between a strong El Niño and a 2.6-million-hectare catastrophe.
That is achievable because the ENSO signal is not what makes peat burn. Intact peat swamp is waterlogged, flooded up to two metres deep in the rainy season, and cannot burn at any El Niño strength. Drought only matters because the fuel has already been dewatered. Every intervention below is ranked by whether it moves that fact or works around it.
1 — Put the water back. Nothing else attacks the cause.
Canals move groundwater below the critical depth from 1.9% of the time to 34%, and take days in the high fire-hazard class from 3.8% to 17.1% — a 4.5× increase in fire susceptibility from the drainage alone. Rewetting reverses that specific number. It is the only intervention on this page that does.
Where the leverage sits: rewetting runs ~$400/ha in smallholder areas against up to $23,500/ha for wide plantation canals — a 59× spread. Which canal blocks get built first is worth more than any modelling improvement. This is a triage problem, not a coverage problem.
2 — Turn the measurement back on before modelling anything
BRGM, the peat restoration agency, was dissolved in December 2024. As of early 2026 SIPALAGA — the telemetered water-table network — and the PRIMS dashboard had not resumed full operation, and BNPB’s institutional budget had fallen 75.6%. Indonesia entered its most dangerous configuration since 2015 having dismantled both the institution and the instrumentation.
This is the cheapest item in the entire response and the one nobody funds. Every water-table model is unanchored without dipwells to calibrate against, and no volume of satellite data substitutes for the ground network.
3 — Fix the number the regulation actually governs
PP 57/2016 declares a cultivated peat ecosystem “damaged” below a fixed 40 cm water table — a threshold criticised as set without prior research. Empirical critical depths run 40–100 cm depending on peat type, with one South Sumatra study at 85 cm. A single national number is wrong in both directions at once: too lax to protect deep peat, too strict to be enforceable elsewhere.
This is the rare place where a model changes a rule rather than decorating one. Site-specific critical depths fall out of the same hydrology stack that predicts the water table.
4 — Make land tenure legible
Fire is cheap and it stakes a claim; unclear tenure sits upstream of ignition economics. Indonesia’s Supreme Court ruled HGU concession documents public in 2017, an administrative court reaffirmed it in 2020, and appeals were exhausted in 2021. The land ministry has still not complied. The Agrarian Minister has separately stated that 537 palm oil companies operate with no HGU at all.
Until boundaries are public, every attribution in circulation runs on reconstructed layers — the ones used to accuse companies, and the ones used to defend carbon issuance.
Suppression, once it is alight
Peat smoulders: flameless subsurface combustion consuming ~75 kg of fuel per m² against ~0.5 kg/m² for surface grass, spreading downward for weeks, surviving rain and reigniting after water-bombing. Suppression takes roughly 5.7 litres of water per kilogram of peat, essentially independent of flow rate or wetting agent — you have to flood the layer.
Aircraft and cloud seeding are where emergency money currently goes. In roadless peat swamp with no water source, a perfectly predicted fire burns exactly as long as an unpredicted one.
Paying villages not to burn
The one randomised trial — 75 West Kalimantan villages paid up to Rp 150 million to stay fire-free, against 200 controls — found 28% of paid villages fire-free against 29% of controls. No effect. The net present value of cleared land is very high relative to the payment, and in villages of ~320 households a single defector loses it for everyone.
The plausible reading of APRIL’s better, self-reported Fire Free Village results is its 984 firefighters, 39 towers and liability exposure — not the cheque.
Fines, as currently collected
Rp 21 trillion in court-ordered fire fines, “almost none” collected. PT Merbau Pelalawan Lestari: a Rp 16.2 tn judgement against a company holding Rp 156 bn in assets — about 1%. The constraint is not detection, not attribution, not even adjudication. It is collection, and no dataset fixes it.
Note also what the landmark rulings ran on: ground-based peat sampling by forensic scientists, not satellite imagery. A defensible chain from pixel to legal liability has not been established in Indonesian courts.
The cost-benefit case, and what is actually budgeted
US$ billions · note the rangesSo who pays for the water
Public funding has never materialised and has just moved backwards, which leaves carbon finance as the only route currently open at the required scale. Indonesia’s forestry carbon export moratorium ended in 2026; Ministry of Forestry Regulation 6/2026 decoupled credit exports from NDC timelines, four projects cleared in July covering ~225,000 ha, and the SRUK registry activated on 9 July.
This is the whole argument for the architecture in the next section. A rewetting programme financed by credits requires continuous water-table measurement and defensible burned-area accounting in order to issue and defend those credits. Build that, and fire prevention is not a cost centre asking for a grant — it is the by-product of an instrument somebody is already paying for.
The unclaimed position remains insurance. An underwriter covering 157,875 ha against fire reversal would be the most natural buyer of continuous hydrology monitoring anywhere in this market, and no such policy appears to exist. Set against that, a business built on a $10 credit is real but fragile: Katingan’s 2020 vintage traded at $9.90/tCO₂e in June 2026, down 15% in two months.
You cannot stop El Niño, and you cannot put out a peat fire. What is left is making sure the peat is too wet to light when El Niño arrives.
Everything above reduces to this. Every other intervention on the page is downstream of a water table.
What a buildable system looks like
06 · ARCHITECTURE & BUYERThe defensible product is not a fire-detection platform. It is a peat hydrology MRV stack — and its buyer is the carbon project and the concession holder, not the disaster agency.
Layer 1 — Sensing: telemetered water-table network
Capex · hardwareDipwells with telemetry on peat hydrological units, at density sufficient to calibrate a spatial model. This is the layer that degraded when SIPALAGA went dark. Without it, every model above is unanchored. Cheapest genuine intervention in the stack, and the one nobody is funding.
Layer 2 — Model: daily water-table depth at ~100 m
The core ML assetRegression from Sentinel-1 SAR backscatter, Sentinel-2 optical, thermal, DEM-derived peat dome geometry, canal network vectors and rainfall — calibrated on the sparse sensor network. Continuous target, dense supervision, physically constrained. Validate against the 40 cm regulatory threshold and site-specific critical depths, since the fixed 40 cm number is not defensible.
Layer 3 — Seasonal outlook and canal-blocking triage
Decision layerENSO/IOD-conditioned outlook at 3–6 month lead, converted into a ranked list of which canal blocks and which hydrological units to rewet before the season. Cost heterogeneity dominates: rewetting runs ~$400/ha in smallholder areas against up to $23,500/ha for wide plantation canals. Triage is where the economics live. Publish per-province skill; do not claim skill in West Kalimantan.
Layer 4 — Burned-area and reversal accounting
The revenue layerSentinel-2 burn-scar mapping with explicit commission and omission reporting, tied to peat depth and emission factors. This is what a carbon project needs to defend issuance, what an insurer would need to price reversal risk, and what an EUDR operator needs for plot-level attestation.
Who actually pays
Ranked by real current spend, the buyers are: concession holders (APRIL alone reports >$9m in suppression resources; Wilmar monitors 24.4 Mha with VIIRS out to 5 km beyond its boundaries), then government emergency response — which spends on aircraft and cloud seeding, not prevention — then donors, then carbon markets, then insurance, which is effectively zero.
The 2026 development worth acting on: Indonesia's forestry carbon export moratorium ended. Ministry of Forestry Regulation 6/2026 decoupled forestry credit exports from NDC timelines; four projects cleared in July 2026 covering ~225,000 ha and ~30 MtCO₂e; the Indonesia Forestry Carbon Hub launched 6 July and the SRUK registry activated 9 July. Katingan Mentaya alone is 157,875 ha with ~20 million credits, AA-rated by both BeZero and Sylvera.
Carbon MRV is the commercial wedge, not fire prevention. A peat rewetting programme financed by credits requires continuous water-table measurement and defensible burned-area accounting — which is exactly Layers 1, 2 and 4. Fire prevention is the by-product you get for free.
Two warnings on that thesis. Katingan's 2020 vintage traded at $9.90/tCO₂e in June 2026, down 15% from $11.60 in April — REDD+ pricing is structurally volatile, and a business built on a $10 credit is real but fragile. And an insurer covering 157,875 ha against fire reversal would be the most natural buyer of continuous hydrology monitoring anywhere in this market; no such policy appears to exist yet. That gap is the most interesting unclaimed position in the stack.
- Do not mix burned-area series. SiPongi (ministry) reports 2.61 Mha for 2015; satellite-lineage products report 4.6 Mha. Different methods, different thresholds. Independent Sentinel-2 mapping put 2026 YTD at ~285,000 ha through 20 August against the official 202,004 ha for January–July — the higher figure is not a government number and the periods differ.
- The 74%-of-hotspots-in-concessions statistic is not a causation claim. CIFOR's estimate is that about one in five fires starts inside an oil palm concession.
- NOAA has not declared a very strong El Niño currently in progress — it forecasts one at >90% confidence for autumn/winter. BMKG does apply the "very strong" label to present conditions. Attribute accordingly.
- Rp 491 bn is BNPB's institutional budget, not Indonesia's total disaster spending; the Rp 5 tn on-call fund sits with the Finance Ministry.
- APRIL's Fire Free Village results are self-reported with no counterfactual. The one proper RCT of village fire incentives found no effect. The plausible reading is that APRIL's outcomes come from its 984 firefighters, 39 towers and liability exposure — not the Rp 100m cheque.
- Not verified in this pass: per-hectare cost of burning vs mechanical clearing (primary sources paywalled); effect sizes from the two 2026 restoration-counterfactual papers (GRL and iScience, both paywalled); month-by-month fire-peak differences between the four Kalimantan provinces.
Sources
07 · PRIMARY REFERENCESSiPongi — Indikasi Luas Kebakaran · Ministry of Forestry burned-area series
NHESS 15:429 (2015) · Seasonal forecasting of Kalimantan fire from ECMWF rainfall; the 6 mm/day threshold and R² = 0.70–0.76
NHESS 22:303 (2022) · ProbFire probabilistic early warning; per-province skill, including the West Kalimantan null
Scientific Reports 12 (2022) · Adding simulated hydrology takes a fire-count ANN from R² ≈ 0.4 to ≈ 0.8 (Riau)
Wetlands Ecology & Management 33:44 (2025) · Hydrology-only random forest beats meteorology-inclusive models, South Kalimantan
Terr. Atmos. Ocean. Sci. (2022) · ENSO × IOD regime composites for Kalimantan burned area
Frontiers in Forests & Global Change (2024) · 21-year Kalimantan peat fire frequency, intensity and burn severity
Critical groundwater depth study · The 4.5× canal effect; 85 cm critical threshold
Nature 420 (2002) · Carbon released from the 1997 Indonesian peat and forest fires
IAWF — The long slow burn of smouldering peat megafires · Smouldering physics
Int. J. Wildland Fire 30:378 · 5.7 L of water per kg of peat for suppression
MDPI Fire 7(1):9 · VIIRS hotspots vs actual burned area over Indonesian peat (62% / 83%)
MDPI IJGI 11(12):601 · 13% of Indonesian VIIRS detections are not biomass burning
MDPI AI 6(10):253 (2025) · Critical review: limited operational uptake of AI in wildfire management
PLOS ONE (2026) · Nusantara Atlas / FireWatch Sentinel-2 burned-area method
Mongabay / Forest Policy & Economics · West Kalimantan conditional cash payment RCT — null result
CIFOR — Clearing the smoke · Actor networks, tenure conflict, ~1 in 5 fires starting in concessions
Pantau Gambut (Jan 2026) · PRIMS and SIPALAGA not fully operational; peat hydrological unit hotspots
tanahair.net · BRGM dissolved, December 2024
Mongabay (Sep 2025) · 281,253 km of peatland drainage canals mapped
Mega Rice Project · 4,000+ km of canals, 1996–98
Mongabay via APSN (Aug 2025) · Rp 21 tn ordered, almost none collected
Mongabay (Jun 2021) · Final court ruling on HGU disclosure, and non-compliance
Mongabay (Oct 2025) · PT Kalimantan Lestari Mandiri ruling; SLAPP against the expert witnesses
World Bank · The cost of fire: $16.1 bn, 1.9% of GDP, 2015
Nature Communications 12 (2021) · Restoration cost-benefit: $3.2–7 bn to restore 2.49 Mha
NOAA CPC ENSO Diagnostic Discussion · >90% chance of a very strong El Niño, 13 Aug 2026
IRI ENSO Quick Look (Aug 2026) · Niño-3.4 weekly +2.7 °C
Bisnis (19 Aug 2026) · 202,004 ha January–July 2026, highest of the last three El Niño years
Koran Jakarta (21 Aug 2026) · West Kalimantan 38,310.86 ha, January–August
Mongabay Indonesia (6 Aug 2026) · WALHI concession-overlay analysis; provincial peat permit areas
Kompas (Jan 2026) · BNPB 2026 budget cut to Rp 491 bn
Fastmarkets (2026) · Forestry carbon moratorium lifted; four projects cleared; credit pricing
Eco-Business · Restoration cost heterogeneity, $400/ha vs $23,500/ha
The Conversation ID · Critique of the 40 cm PP 57/2016 threshold
Peat hydrology is measurable.
If you are financing peat rewetting, underwriting reversal risk, or building the MRV layer that both depend on, we would like to compare notes.